

 Network: internet check
Available via the dialler and remote setup
| 1. Internet status: view the current internet connection status |
| 2. Network check: configure the method for checking the internet connection |
| 3. Diagnostics: ping the domain of a specific interface |
Additional feature via remote setup
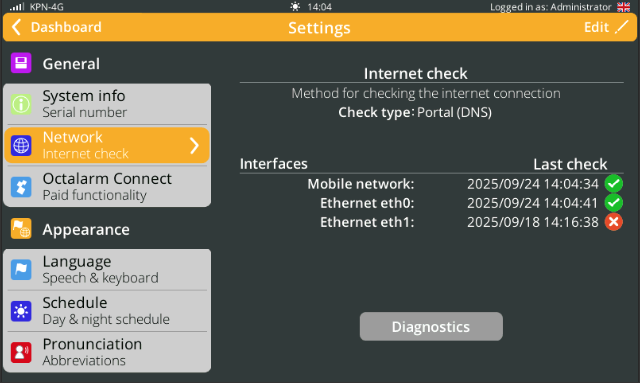
1. Internet status: connection status per interface
Under Network: Internet Check, you can view:
- the check type: the method the dialler uses to verify the internet connection;
- the last check per interface and its result:
 successful or
  failed.
Reporting system failures
You can configure each interface to determine whether the system reports a system failure if the internet check fails.
- Go to
Alarms. - Tap the
Systemtab. - Select the relevant alarm:
Eth0 internet failure,Eth1 internet failure1, orGSM internet failure. - Click
Edit, adjust the alarm settings, and select the desired call list or service group. - Click
Save.
Good to know:
- The Delay before active is set to half an hour by default for these alarms.
- If an interface fails, the active connection automatically switches to another interface. This ensures your alarms are always guaranteed.
2. Set up network check: method for detecting the internet connection (check type)
There are 3 ways to check the connection:
- Cable: is the Ethernet cable connected / not connected properly;
- Portal (DNS): based on a DNS check to the portal’s configuration servers. This type is default;
- Hostname or IP address: an http(s) check based on a custom URL. The custom URL must be http or https based and may be a URL or IP address.
Adjusting the setting
- Open
Settings. - Select
Networkin the navigation menu. - Click
Edit. - Choose the required check type:
Cable,Portal (DNS), orHostname or IP address. If you selectHostname or IP address, enter the relevant URL or IP address. - Click
Save.
3. Diagnostics: running a ping command
You can run a ping command over the available interfaces to support troubleshooting and diagnostics.
- Open
Settings. - Select
Networkin the navigation menu. - Click
Diagnostics. - Use the double arrows to select an interface:
Web portal,Mobile network,Ethernet eth0, orEthernet eth11. - Enter the host name or IP address.
- Click
Test.
The dialler displays the ping result in the window.